CAN Analyzer
Applies to: IOcan · Standalone controller. What this means
This is the tool for the question "is anything on the bus at all?" It shows live traffic through the device, opens captured logs, and replays them so a capture taken in the car can be studied at a desk.
The layout
Three parts:
- RX and TX lists down the left, each with + Add, for the frames you want to watch or send.
- Tabs across the top of the main pane. Live is always the first; each imported file opens as its own tab beside it.
- A toolbar: Export Can Logs, CAN Settings, Custom Input, Import Dump and Expert Mode. Two indicators above it show the capture state — CANDUMP and REC.
Expert Mode swaps the whole workspace for a plot and a signal table — see Expert Mode below.
With no device connected the Live tab stays empty and says so. That is the expected state, not a fault — there is no bus to listen to.
Opening a capture
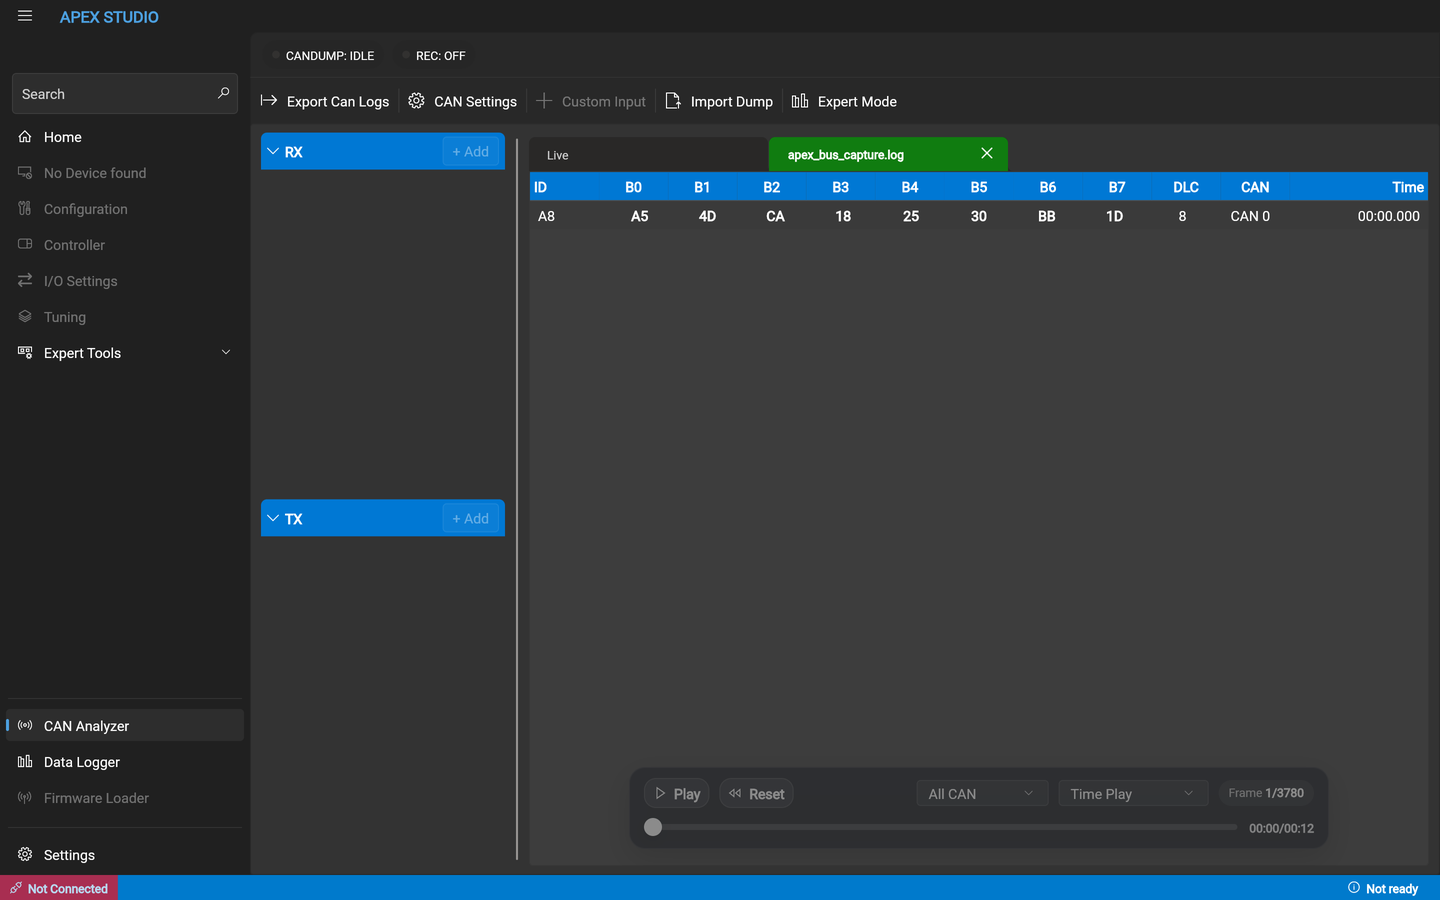
Import Dump opens a candump-format log as a new tab. The frame table gives the ID, the eight data bytes, the DLC, which CAN channel it arrived on, and a timestamp.
Replaying it
The bar along the bottom steps through the capture rather than dumping it all at once — Play and Pause, Reset, a channel filter, a play mode, a frame counter and a scrub bar with elapsed and total time.
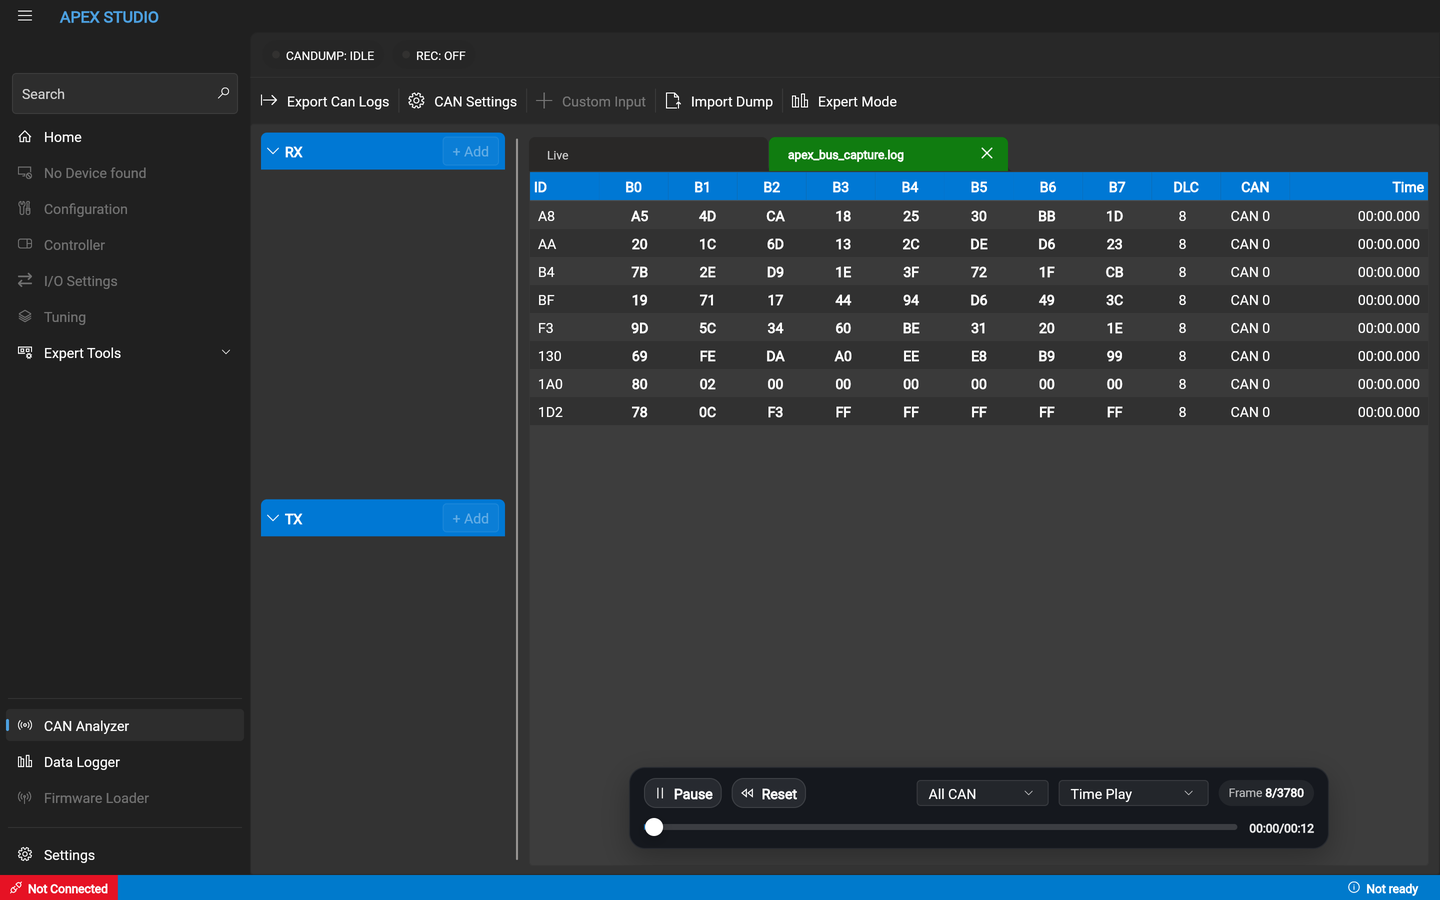
Play mode matters. Playing in time replays at the capture's own rate, which is what you want when checking whether a frame's period is what you expected.
Building a CAN input from a capture
Custom Input turns captured traffic into a CAN bus input definition, shows a live preview of the decoded value while you set it up, and transfers the finished input into your configuration automatically — there is nothing to write down and retype.
That preview is the point. Defining a CAN input normally means reading a byte layout off a spec sheet and hoping you counted right — the first confirmation you get is a channel reading nonsense in the car. Here you build the definition against traffic you have already captured and watch the number as you adjust it, so a wrong offset or a wrong byte order is obvious immediately.
This is the tool for an ECU or module that has no preset. If you are working from a bus you sniffed yourself, this is where the guesswork comes out of it.
Custom Input needs a connected device. The button stays greyed out until one is attached — an imported capture on its own does not enable it. This is the one job on this page you cannot do at a desk.
Expert Mode — signal analysis
Expert Mode is a different workspace, not a busier view of the same one. It replaces the frame table with a plot above and a signal table below, and its job is working out what the bytes in a frame actually mean.
You describe how to pull a value out of a frame, and it draws that value over time. Get the description wrong and the trace is obviously wrong; get it right and you have found the signal.
Enter and leave it from the toolbar. In Expert Mode the toolbar changes — Export Can Logs becomes Record, and Expert Mode becomes Exit Expert Mode.
Defining a signal
Each row of the signal table is one value to extract:
| Column | What it sets |
|---|---|
| Bus · Frame | Which CAN channel, and which frame ID |
| Offset · Length | Where the value starts within the frame, and how many bits it is |
| Mode | How to read those bits — byte order and signedness, such as LE uint |
| Multiplier · Add | Scaling into engineering units |
| Show · Plot | Whether the row is drawn, and which plot it goes on |
| Mux offset · Mux length · Mux value | For multiplexed frames — which sub-message this row belongs to |
| FrameLength | Expected frame length; -1 to accept any |
| Comment · Analysis comment | Your own note, and the tool's — it reports No matching frame when nothing in the traffic matches the row |
Watch the Analysis comment column. No matching frame means the row is looking for something that is not there — a wrong ID or a wrong length — which is a different problem from a signal that decodes but reads nonsense.
Working with several signals
- More than one plot. The Plots control adds and removes them, and each signal row chooses which plot it draws on. Keep unrelated signals apart rather than stacking everything on one axis.
- Save Signals and Load Signals store a set. A frame layout you worked out once is worth keeping — reload it the next time you meet that module instead of deriving it again.
- Clear empties the table; Paste brings a definition in from elsewhere.
Which tool for which job
| You want to | Use |
|---|---|
| Work out what an unknown frame contains | Expert Mode — plot it and see |
| Turn a signal you have identified into a device input | Custom Input — it transfers into the configuration |
They are complementary: Expert Mode is where you find the signal, Custom Input is where you keep it.
What it is good for
- Confirming a bus is alive before suspecting a configuration.
- Checking bitrate — a wrong bitrate usually shows as nothing at all rather than as corrupted frames.
- Finding which channel a module is on when a car has more than one bus.
- Proving an ECU actually sends the signal a preset expects.
- Working out a CAN input for a module with no preset, against real traffic rather than a spec sheet — see above.
For what the device itself puts on the bus, see what the device transmits. For diagnosing a bus that is not working, see CAN bus diagnostics.